
Key Takeaways
- This capstone primer on the fundamentals of investing in digital assets demonstrates how core and satellite digital assets can be deployed inside a traditional stock/bond portfolio.
- Digital assets have grown into a mid-sized alternative asset class, representing roughly 13% of combined alternative-asset market capitalization alongside private equity, private credit, venture capital, real estate, infrastructure, hedge funds, and natural resources.
- Both core and satellite digital assets have historically shown low correlation with stocks, bonds, and private markets, and realized volatility for both groups has trended lower as institutional adoption—particularly via spot Exchange Traded Products (ETPs)—has grown.
- Hypothetical portfolios adding 1%, 3%, or 5% allocations of core, satellite, or core + satellite digital assets to a 60/40 stock/bond portfolio improved the Sharpe ratio in every scenario evaluated for the three-year period ending in August 2026.
- We see an 80/20 blend of core + satellite digital assets as an attractive combination: it lifts returns and Sharpe ratios versus a 60/40 benchmark while avoiding the sharper increases in volatility and drawdown that come from a satellite-only allocation.
I. Digital Assets Have Come of Age
The digital asset world has come of age. From its modest beginnings with the launch of Bitcoin in 2009, the asset class has grown to encompass a large, diverse, and heterogeneous investable universe ranging from currencies to development platforms to applications.
We created the Grayscale Digital Asset Investing Fundamentals course1 (and its accompanying primer series2) to chronicle this evolution and give investors a chance to learn how the asset class works, its underlying technologies, how assets are created, stored, and secured, and how to value them. All these materials are available for watching, reviewing, and downloading at the Grayscale Institute.3
This primer (the last in our Fundamentals series) focuses on the topic of deploying digital assets into traditional portfolios. But before we delve into the analysis (and the data behind it), let’s do a quick recap of key fundamentals we have learned in the first four classes (and seven primers).
We start with a definition: Digital assets are those whose ownership is tracked on a blockchain, a cryptographically secured, decentralized ledger. Blockchains generally operate on either a proof-of-work or a proof-of-stake basis, which determines how new tokens are created (i.e., their supply mechanism) and how the network is secured.4
Digital assets are as varied as traditional ones. Some function as currencies, or stores of value. Others function as the “operating systems”—the infrastructure—on which applications are built. Still others are the applications themselves, most notably in the broad category of decentralized finance (DeFi).
From a valuation perspective, Grayscale believes that digital assets, for the most part, can be valued using the same lenses typically applied to traditional assets. They generally fall into two broad categories: commodities, where value is a function of scarcity and usage, and financial claims, akin to equities and bonds, where value is anchored to cash flows.
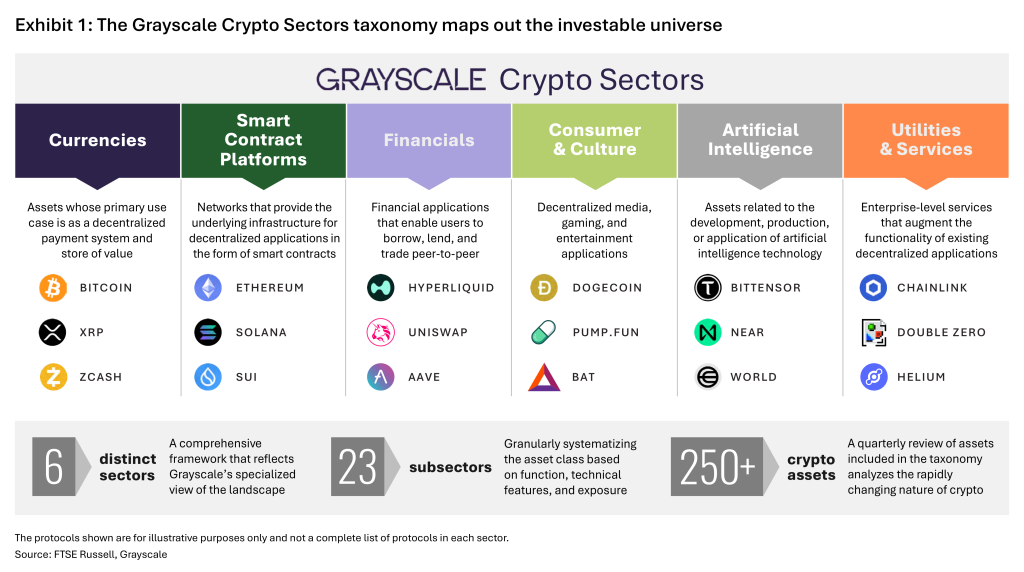
We have also developed a taxonomy to help map the digital asset universe. In partnership with FTSE Russell, we created the Grayscale Crypto Sectors, which organizes digital assets into six sectors and 23 subsectors: Currencies, Smart Contract Platforms, Financials, Consumer & Culture, Artificial Intelligence, and Utilities & Services5 (Exhibit 1). For the purposes of portfolio construction, we have grouped digital assets into two categories: core and satellite. (We dive into details later in this paper.)
II. Sizing the Opportunity within an Alternatives Allocation
Another important point for any portfolio conversation is market size, and the growth of digital assets over the last decade has been dramatic. Digital assets have evolved, as Exhibit 2 shows, into a mid-sized alternative asset class.
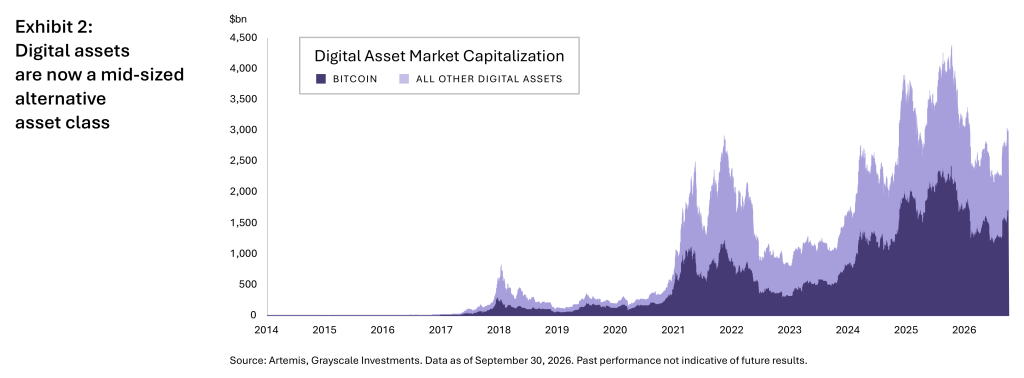
Bitcoin still accounts for the majority of the industry’s market capitalization, but other digital assets have made consistent inroads as the applications discussed throughout this course—decentralized finance, smart contract platforms, artificial intelligence, and more—have matured.
Exhibit 3 breaks down the digital asset universe market cap by sector (measured by the Grayscale Crypto Sectors Index). As of September 30, 2026, Currencies and Smart Contract Platforms dominate the industry, together accounting for roughly 95% of the over $2.5 trillion digital asset market.
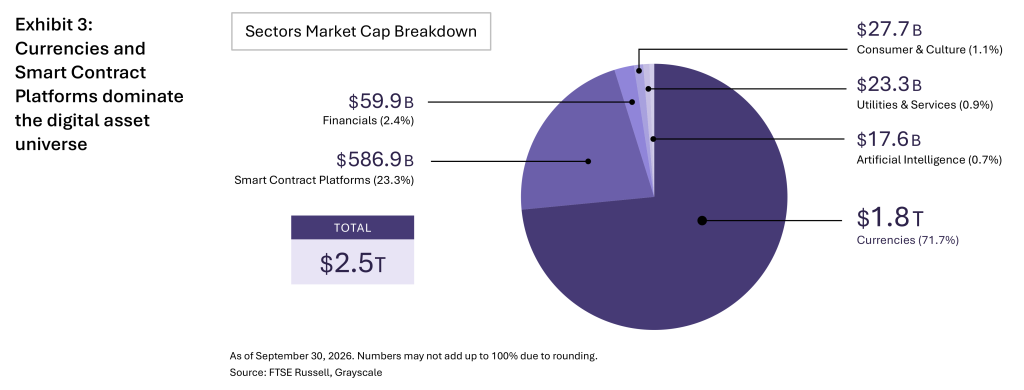
Currencies alone, led by Bitcoin, represent 71.7% of the total. Smart Contract Platforms, the “operating systems” on which the rest of the ecosystem is built, represent another 23.3%. The remaining four sectors—Financials, Consumer & Culture, Utilities & Services, and Artificial Intelligence—are considerably smaller by market capitalization, but as earlier primers in this series discuss in depth,6 represent some of the most active areas of development in the space.
It is also worth noting how much the aggregate figure can swing: after peaking above $4 trillion in 2025, digital asset market capitalization stood at roughly $2.5 trillion as of this writing. That volatility is a defining feature of a still-young asset class, and one that should inform any discussion of sizing an allocation.
Even with that volatility, digital assets are no longer a rounding error next to other alternative asset classes. Exhibit 4 situates digital assets against private equity, hedge funds, private credit, venture capital, real estate, infrastructure, and natural resources: digital assets now represent approximately 13% of the combined market capitalization of the alternatives universe.
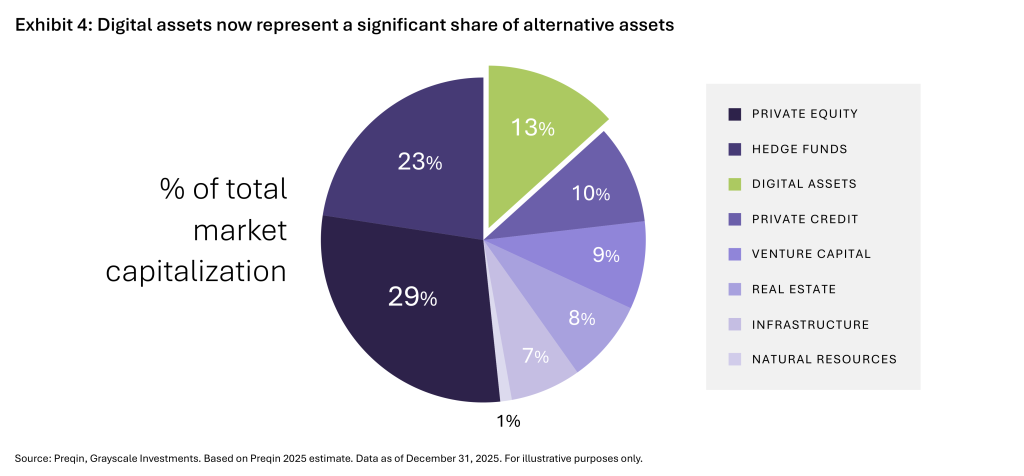
For an investor building a diversified sleeve of alternative assets, this 13% figure can be a useful anchor. Anyone with zero exposure to digital assets is, by this math, actively underweighting a meaningful and growing share of the alternatives universe.
Digital assets also offer a structural advantage relative to many of these other categories: liquidity. Private equity, private credit, real estate, and venture capital all involve materially reduced liquidity relative to publicly traded markets. Digital assets, by contrast, trade 24 hours a day, seven days a week, with liquidity that in many cases rivals—or exceeds—that of publicly traded stocks and bonds.
III. Diversification Benefits: Low Correlation with Private and Public Markets
Size alone does not make a compelling case for an allocation. What makes digital assets particularly interesting from a portfolio point of view is their correlation with other asset classes. Exhibit 5 shows that digital assets have historically exhibited lower correlation with private equity than most other private-market categories.
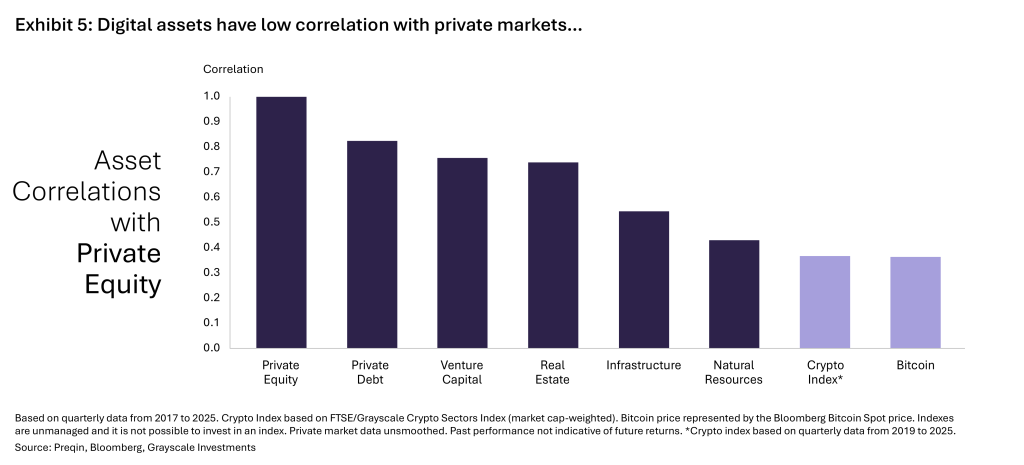
Since 2017 and 2019, respectively, the returns of Bitcoin and the broader crypto index (measured by the Grayscale Crypto Sectors Index) have averaged a correlation with private equity of roughly 0.36 and 0.37, both well below the correlations that private debt, venture capital, real estate, and infrastructure exhibit. We believe this reflects the fact that digital assets are exposed to different return drivers than private market investments, allowing them to complement, rather than duplicate, the sources of return of an existing private markets allocation.
The same relationship holds true in public markets. Exhibit 6 shows that both Bitcoin and the Crypto Index have a correlation with the S&P 500 of less than 0.5—lower than the correlation exhibited by the Nasdaq, international stocks, high-yield corporate bonds, and investment-grade corporate bonds, and roughly in line with commodities.
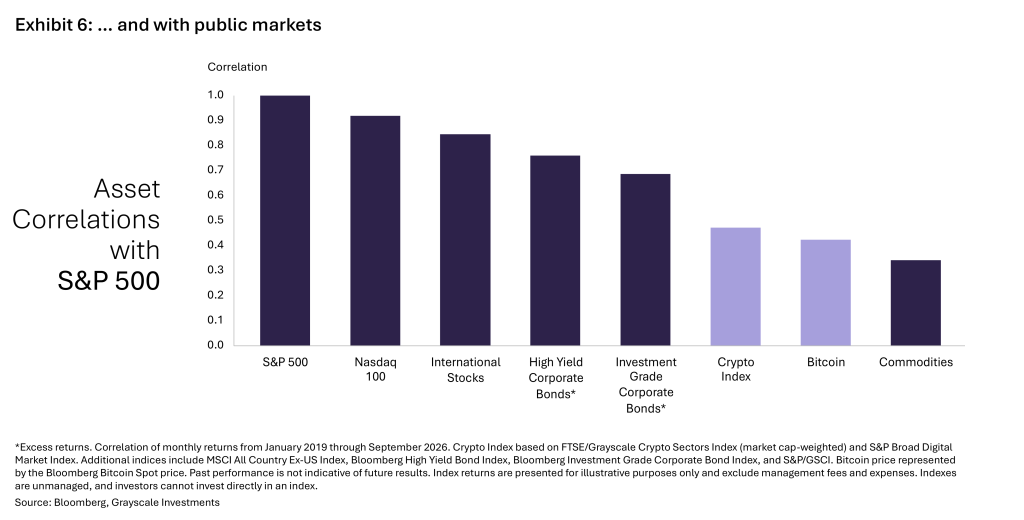
Because the relevant question for a portfolio is not an asset’s standalone volatility but its contribution to total portfolio risk, this combination of relatively low correlation and meaningful historical returns suggests that a modest digital-asset allocation may be additive, on a risk-return basis, to a traditional portfolio—a point we return to, with data, in the sections that follow.
IV. A Truly Heterogeneous Asset Class
Another point to highlight when assessing portfolio allocation is how heterogeneous the digital asset universe truly is. This is key to remember, especially in a world where many investors still think of crypto as a homogeneous asset class defined by Bitcoin. Of course, Bitcoin is—and will continue to be—a very important crypto asset, but it is definitely not the only one, and it is not representative of the whole, either.
As Exhibit 7 shows, digital assets and their underlying blockchain technology represent a wide array of use cases and technologies, ranging from general-purpose “operating systems” to a whole world of decentralized finance, including borrowing, lending, spot and futures exchanges, derivatives markets, and stablecoins. It also includes decentralized physical infrastructure, a world of oracles and data exchange, wallets and payments, and an incredible platform for AI development, including the very topical world of agentic AI.
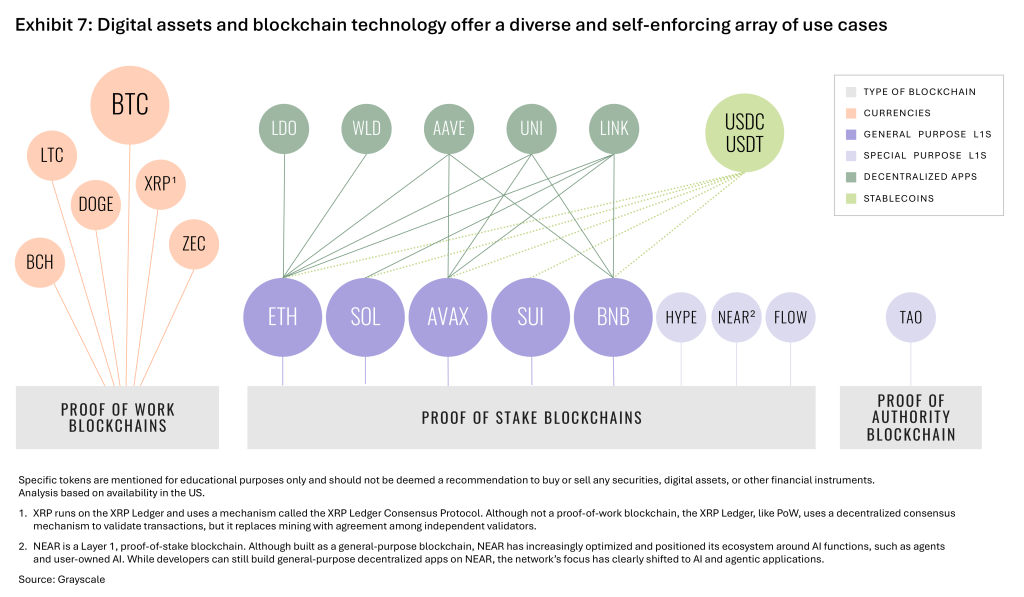
Another takeaway: The world of digital assets—just like the technology world—reinforces itself. As Exhibit 7 illustrates, projects and protocols build on each other. Just like Apple’s creation of the iPhone and iOS has paved the way for an enormous market of apps covering, seemingly, anything we can imagine, the advent of blockchain technology has paved the way for a large—and quickly growing—ecosystem of “operating systems,” apps, and physical structures and businesses.
V. Core and Satellite Digital Assets
For the purposes of portfolio construction, this course has organized digital assets into two buckets: core and satellite (Exhibit 8). We chose this framework for two reasons. First, it uses language that is already familiar to most investors, and second, it fits the current state of the digital asset universe, where a small number of assets account for a large share of the market’s total value.
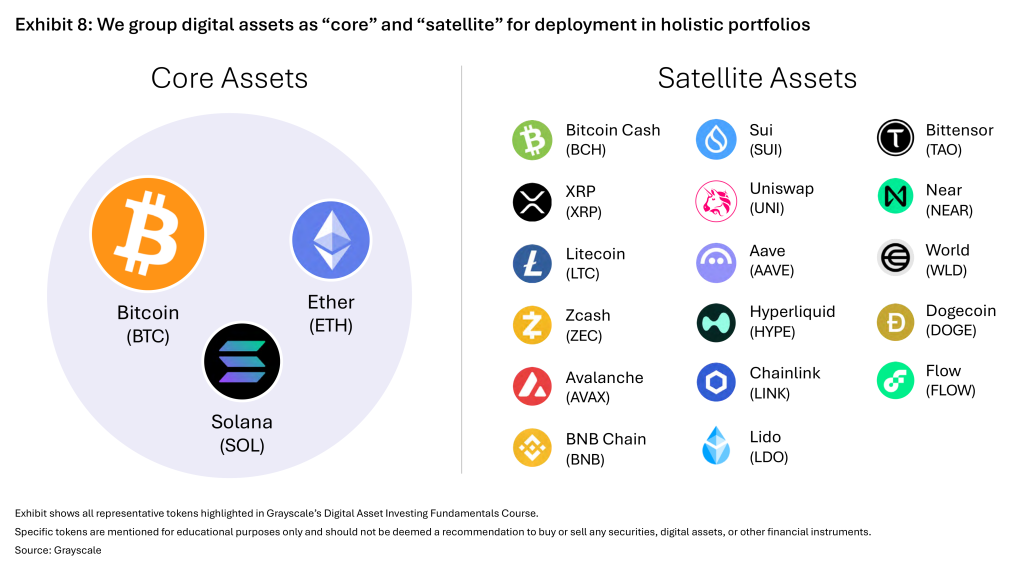
As previously noted, a large majority of digital asset market capitalization sits within the Currencies and Smart Contract Platforms sectors, and within those sectors, in a handful of individual tokens—specifically Bitcoin, Ether, and Solana, which together account for more than 70% of the industry’s market capitalization. We consider these three tokens as the core digital asset allocation: the foundational, largest, and most established assets in the digital asset universe.
Satellite assets, by contrast, are the smaller, and typically more volatile, tokens and sectors that sit around that core. Across the seven previous primers in this series, we highlighted 17 representative satellite tokens spanning all six sectors: Bitcoin Cash, XRP, Litecoin, and Zcash in Currencies; Avalanche, BNB Chain, and Sui in Smart Contract Platforms; Uniswap, Aave, and Hyperliquid in Financials; Chainlink and Lido in Utilities & Services; Bittensor, NEAR, and World in Artificial Intelligence; and Dogecoin and Flow in Consumer & Culture.
Investors should expect satellite assets to be more volatile, on a standalone basis, than core assets—but, as the data in the remainder of this paper shows, that extra volatility may be a source of complementary, diversifying return within a broader portfolio.
VI. A Portfolio Construction Theory Refresher
Before turning to the data, it is worth refreshing a few concepts from modern portfolio theory (MPT), the analytical framework underpinning the remainder of this paper. MPT offers investors a way to build and optimize portfolios for the highest expected return per unit of risk—in other words, the highest return for a given level of risk, or the lowest risk for a given level of return. Exhibit 9 summarizes its three key analytical components: returns, risk, and allocation.
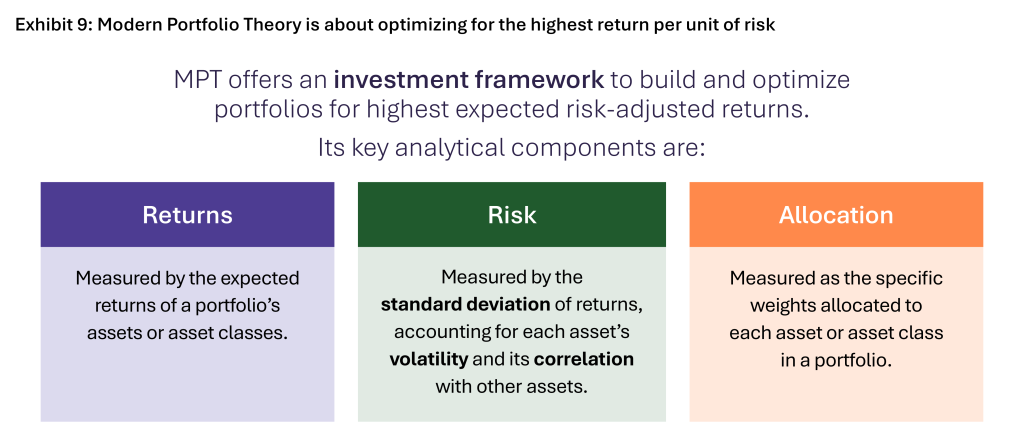
That middle component—risk—is where investors evaluating digital assets on a standalone basis can go astray. Viewed alone, digital assets’ high volatility might reasonably give an investor pause. But portfolio construction is not simply the sum of each asset’s standalone risk. It is a function of how those assets move together. Because digital assets have historically exhibited low correlation with stocks and bonds (Exhibit 6), a digital asset allocation can be added to a traditional portfolio without a proportional increase in total portfolio risk—provided the allocation is sized appropriately.
As a general rule, allocations below 10% have added return faster than they add risk; above that threshold, the math of diversification can start to work against the investor, and a highly volatile sleeve can begin to dominate total portfolio risk. The remainder of this paper works through smaller incremental allocations to digital assets in detail, for core, satellite, and combined core + satellite allocations, each at weights of 1%, 3%, and 5%, when added to a traditional portfolio of 60% equities and 40% bonds.
A quick but important note: every portfolio in the following sections is hypothetical. None was actually managed or traded, no investor earned these returns, and they were built with the benefit of hindsight and without fees, taxes, or trading costs. The purpose here is educational: to illustrate how adding digital assets to a traditional portfolio has historically affected return, risk, and diversification.
VII. Deploying Core Digital Assets
Our core digital asset portfolio holds 70% Bitcoin, 15% Ether, and 15% Solana, rebalanced monthly. Exhibit 10 summarizes its standalone annualized performance in the three years ended in August 2026, as well as the result of adding it to a traditional 60/40 portfolio of stocks and bonds at weights of 1%, 3%, and 5%.7
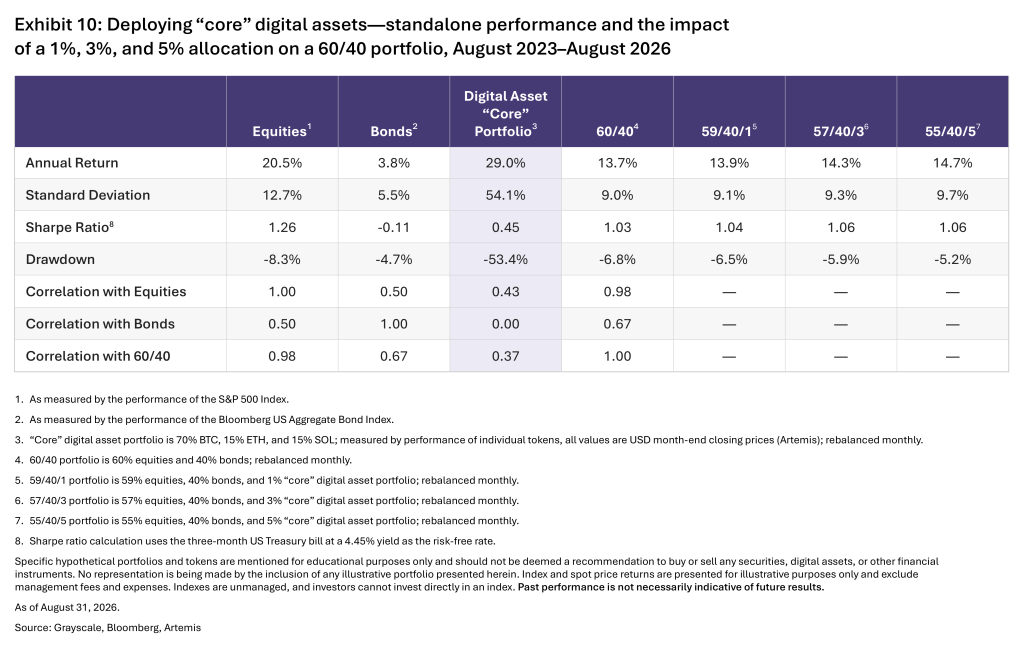
On a standalone basis, the core digital asset portfolio returned 29.0% annually in the studied period—more than the 20.5% of equities—but with a standard deviation of 54.1%, more than four times that of equities. Its correlation with equities was a modest 0.43, its correlation with bonds was effectively zero, and its correlation with the 60/40 portfolio was 0.37.
That low correlation is what allows the core digital asset portfolio to be added to a 60/40 allocation without a proportional increase in risk. At a 1% allocation, annualized return rises from 13.7% to 13.9%, while standard deviation rises only modestly, from 9.0% to 9.1%—and maximum drawdown actually improves, from -6.8% to -6.5%. The Sharpe ratio—a measure of risk-adjusted performance—improves from 1.03 to 1.04, a signal that the allocation added more return than risk.
At a 3% allocation, the pattern strengthens: return rises to 14.3%, drawdown improves further to -5.9%, and the Sharpe ratio rises to 1.06. At 5%, return reaches 14.7% (a full percentage point above the 60/40 benchmark), the Sharpe ratio stays flat at 1.06, while drawdown improves to -5.2%, roughly 24% better than the 60/40 portfolio’s own drawdown, even as standard deviation rises only to 9.7%.
We draw two conclusions from the above. First, it illustrates the difference between an asset’s standalone risk and its contribution to portfolio risk: the core digital asset portfolio’s 54.1% standalone volatility does not translate, even at a 5% weight, into a proportional increase in portfolio-level volatility. Second, it illustrates that volatility and drawdown are distinct dimensions of risk. A volatile asset need not increase portfolio drawdown if its worst periods do not coincide with the worst periods of the rest of the portfolio—which is exactly what we observed.
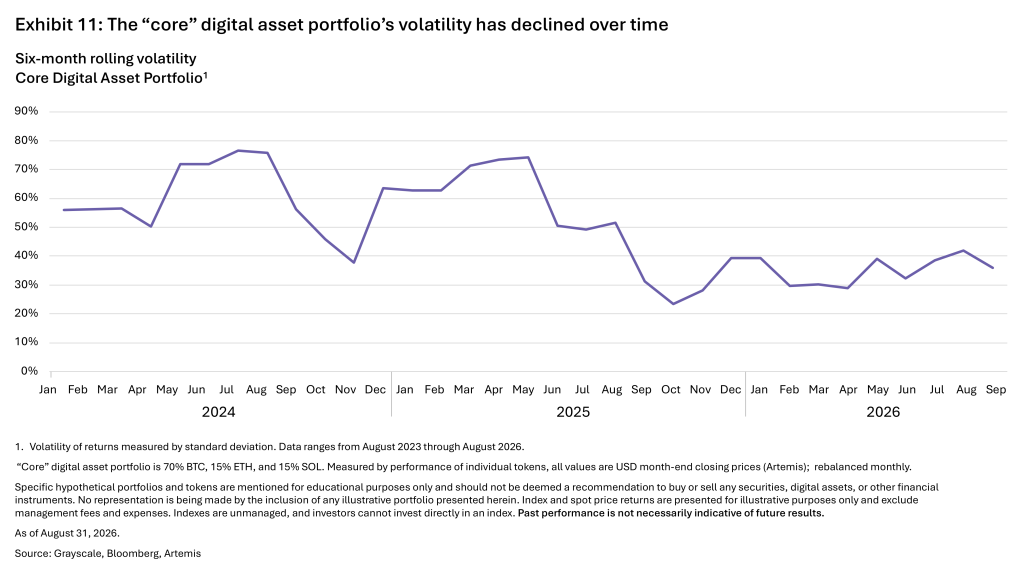
Standalone volatility is also not static, and the trend is instructive. Exhibit 11 shows the core digital asset portfolio’s six-month rolling volatility since 2024: it peaked near 77% in mid-2024, fell to a low of roughly 23% in the fourth quarter of 2025, and has since stabilized in a considerably calmer 30%-to-40% range through 2026. We attribute part of this decline to the rapid growth of commingled vehicles such as spot ETPs, which have broadened the investor base beyond purely speculative, short-horizon participants. A less volatile core portfolio only strengthens the case made in this section: the volatility risk an investor is taking on by adding core digital assets to a traditional portfolio has been falling, even as the return and diversification benefits have persisted.
VIII. Deploying Satellite Digital Assets
Our satellite digital asset portfolio is built from the top 10 of the 17 representative satellite tokens covered in this course (Exhibit 8), ranked by market capitalization as of August 31, 2026, and equally weighted: Bitcoin Cash, XRP, Litecoin, Zcash, Avalanche, BNB Chain, Sui, Hyperliquid, Chainlink, and Dogecoin.8 The portfolio is rebalanced monthly.
One caveat before we look at the numbers: We selected these 10 tokens based on their market capitalization at the end of August 2026 and then measured how they performed over the past three years. That means the basket benefits from hindsight. Zcash, for example, appreciated more than twentyfold over the past year, and Hyperliquid didn’t exist for the first part of the period. An investor in 2023 could not have known to hold this exact basket. So, treat the satellite results as educational and an illustration of what diversified exposure to smaller sectors can look like, not as achievable historical returns.
As expected, the satellite portfolio’s standalone statistics run hotter than the core portfolio’s in both directions. Annual return was 49.0%, well above the core portfolio’s 29.0%, but with a standard deviation of 74.9%. Correlations were also somewhat higher than the core portfolio’s—0.48 with equities and 0.15 with bonds, versus 0.43 and 0.00, respectively. Because of these higher standalone correlations and higher standalone risk, we see the role of a satellite allocation as skewing more toward return enhancement than toward diversification or risk reduction.
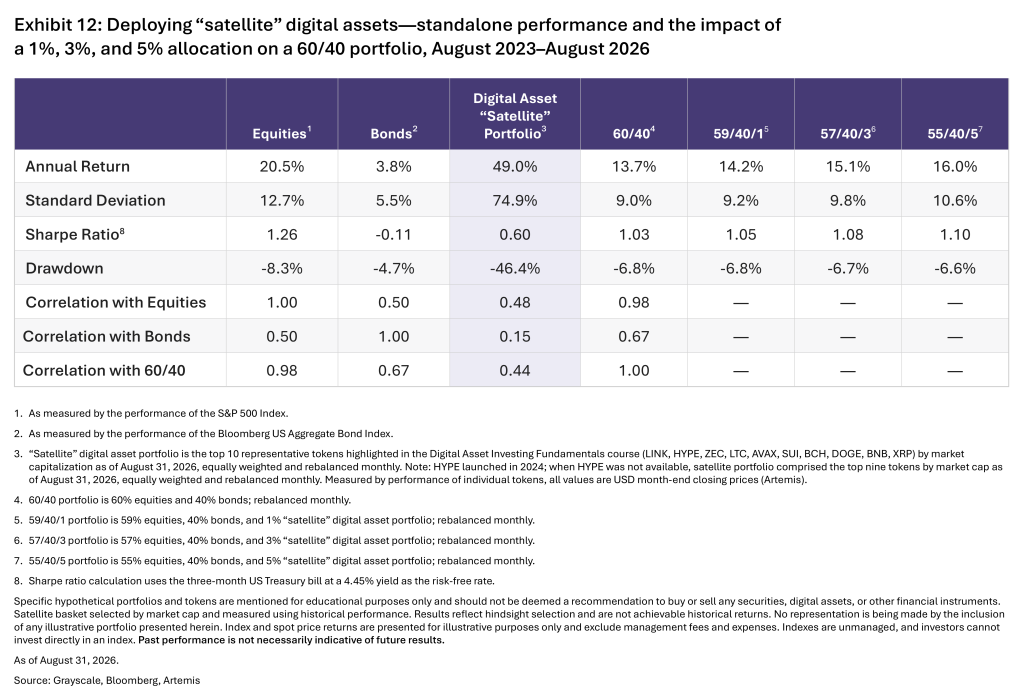
That said, the return enhancement is substantial. Even a 1% allocation, funded, as before, from equities, moved the 60/40 portfolio’s annualized return from 13.7% to 14.2%, a similar pickup to the one a 3% allocation to core digital assets produced, while standard deviation moved only from 9.0% to 9.2% and drawdown was effectively unchanged, at -6.8%. At a 3% allocation, return reached 15.1%, the Sharpe ratio improved from 1.03 to 1.08, and drawdown remained roughly flat.
At a 5% allocation, the satellite portfolio’s higher standalone risk becomes more visible: standard deviation rose to 10.6%, the largest increase of any scenario modeled in this paper—but it came with a positive return contribution, with returns rising to 16.0% (a pickup of 2.3 percentage points over the 60/40 portfolio) and the Sharpe ratio rising to 1.10, the highest of any single allocation tested. Notably, even at this larger allocation, maximum drawdown improved slightly, to -6.6% from -6.8%, underscoring again that volatility and drawdown do not move in lockstep.
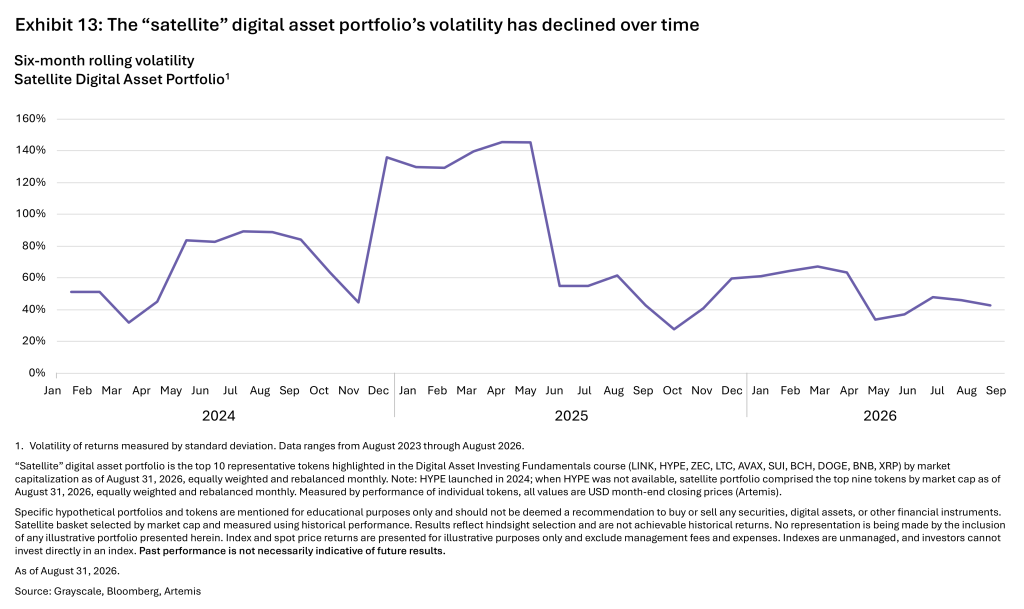
The satellite portfolio’s volatility has followed a similar, if noisier, path (Exhibit 13). Six-month rolling volatility peaked above 140% in mid-2025, fell to roughly 25% by the fourth quarter of 2025, and has since settled into a 35%-to-65% range—meaningfully elevated versus the core portfolio, but well below the extremes of 2025. As with the core portfolio, we see this moderating trend as a byproduct of a maturing, increasingly institutionally-owned market, and a further suggestion that the modest allocations modeled in this paper may understate how compelling a satellite allocation could prove going forward.
IX. Deploying Core + Satellite Digital Assets
We now turn to a blended allocation of our digital sleeve: 80% core assets and 20% satellite assets, the “core + satellite” portfolio. We view this blend as a way to capture some of the outsized return potential of satellite assets while tempering the more pronounced risk and drawdown characteristics of a satellite-only allocation.
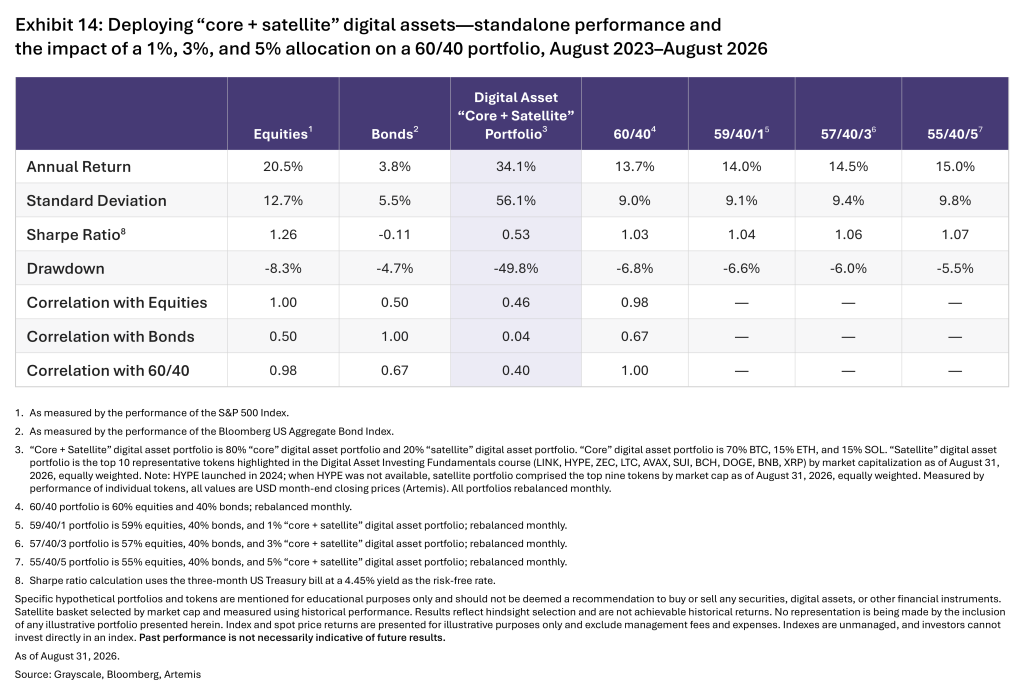
On a standalone basis, the core + satellite portfolio returned 34.1% annually with a standard deviation of 56.1%—a meaningfully better risk-adjusted outcome than the core portfolio alone, with a Sharpe ratio of 0.53 versus 0.45, while remaining less volatile, on a standalone basis, than the satellite portfolio alone. Correlations with equities and bonds, at 0.46 and 0.04, sit between the core and satellite portfolios’ own correlations, as one would expect from a blend of the two.
Added to a 60/40 portfolio, the pattern we observed for core and satellite allocations individually repeats, and in several respects improves. At a 1% allocation, return rises to 14.0% and drawdown improves to -6.6%. At 3%, return reaches 14.5%, the Sharpe ratio improves to 1.06, and drawdown improves further, to -6.0%. At 5%, return reaches 15.0%—130 basis points above the 60/40 benchmark—while the Sharpe ratio rises to 1.07 and drawdown improves to -5.5%, roughly 19% better than the 60/40 portfolio’s own drawdown. Standard deviation at the 5% weight rises only to 9.8%, a smaller increase than the satellite-only allocation produced at the same weight.
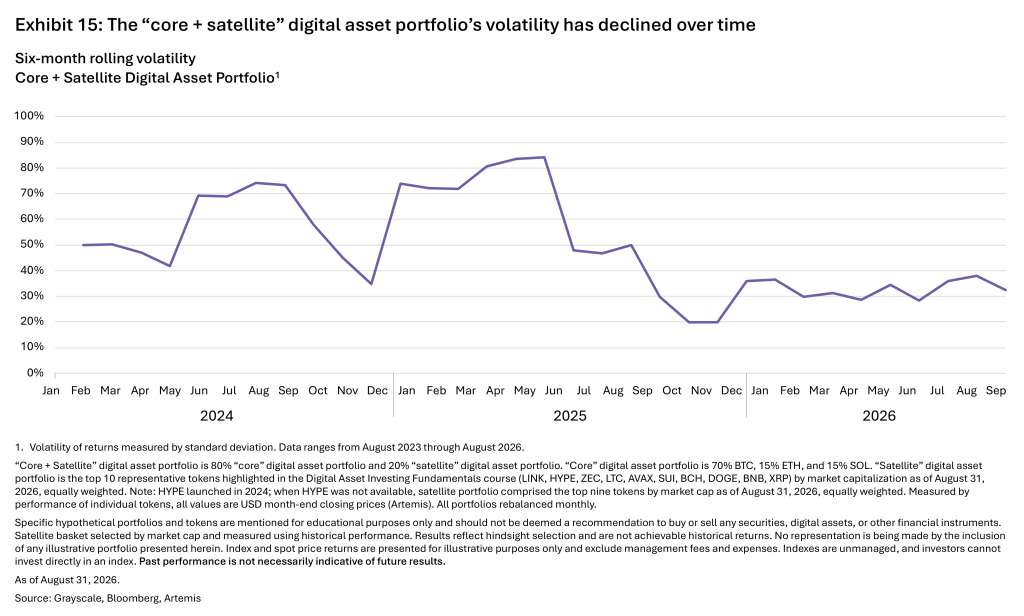
Blending the two portfolios dampens this volatility pattern somewhat without eliminating it (Exhibit 15): six-month rolling volatility for the core + satellite portfolio peaked near 84% in mid-2025, bottomed around 20% in late 2025, and has traded in a roughly 30%-to-40% band for most of 2026—closely tracking the core portfolio’s own trend, since core assets make up 80% of this blend. Taken together, Exhibits 11, 13, and 15 tell a consistent story: the volatility an investor takes on by adding digital assets to a portfolio has been declining as the asset class has matured, even as the return and diversification benefits detailed throughout this section have persisted.
X. The Impact on Risk-Adjusted Returns
Exhibit 16 brings the three 5% allocation scenarios together—core, core + satellite, and satellite—alongside the unmodified 60/40 portfolio, across three metrics: Sharpe ratio, annual return, and maximum drawdown.
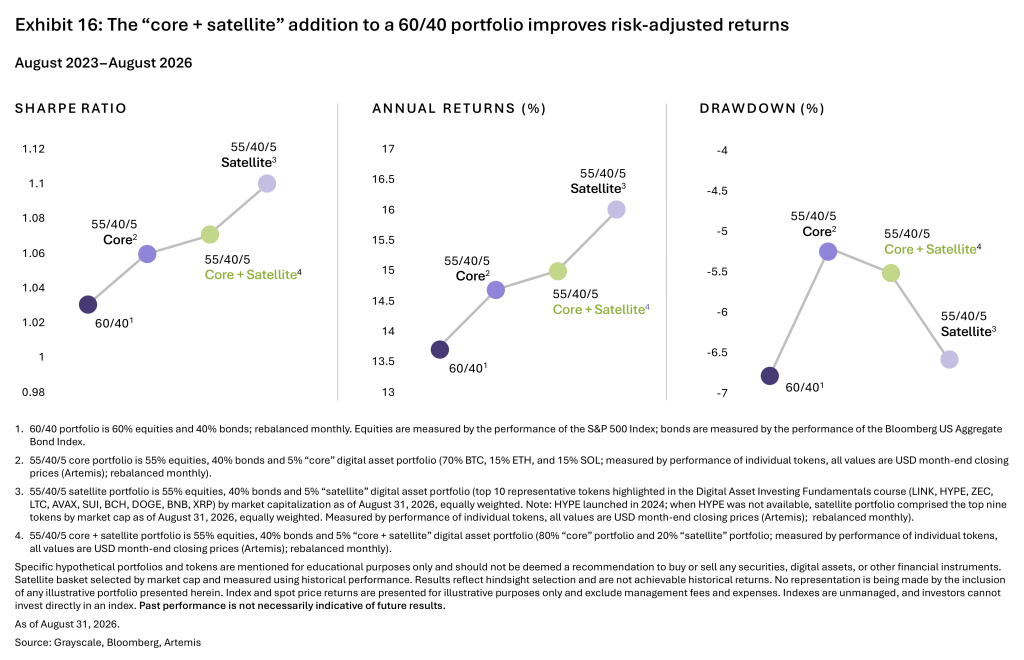
Two patterns stand out. First, Sharpe ratios and returns both improve, in a consistent, step-wise fashion, as we move from a pure core allocation, to a blended core + satellite allocation, to a pure satellite allocation—each step adds more of the satellite portfolio’s higher return, and, given its low correlation to the other assets in the portfolio, enhanced risk-adjusted return along with it. Second, and perhaps more strikingly, the core allocation shows the best (least negative) drawdown of the four scenarios, with the core + satellite allocation following close behind. Interestingly, all three digital allocations improved on the 60/40 benchmark’s own drawdown.
Taken together, we believe a core + satellite allocation offers an attractive balance for many investors considering a digital asset allocation, because it:
- Shows higher returns than the 60/40 portfolio, or than an equivalent allocation to core digital assets alone;
- Improves the Sharpe ratio relative to both the 60/40 portfolio and a core-only allocation;
- Does so at similar volatility as a core-only or satellite-only allocation of the same size; and
- Offers a considerably more compelling drawdown profile than either the 60/40 portfolio or a satellite-only allocation.
None of this is to say that we expect digital assets to reduce potential portfolio drawdowns in every future period—they will not. But if correlations to stocks and bonds remain as low in the future as they have been historically, we believe digital assets can continue adding more return than risk at the modest allocation sizes considered in this paper.
XI. How to Access the Tokens Discussed in This Course
Exhibit 17 summarizes how US investors can access each of the 20 tokens discussed across this eight-primer series, split between the three core assets and the 17 representative satellite assets.
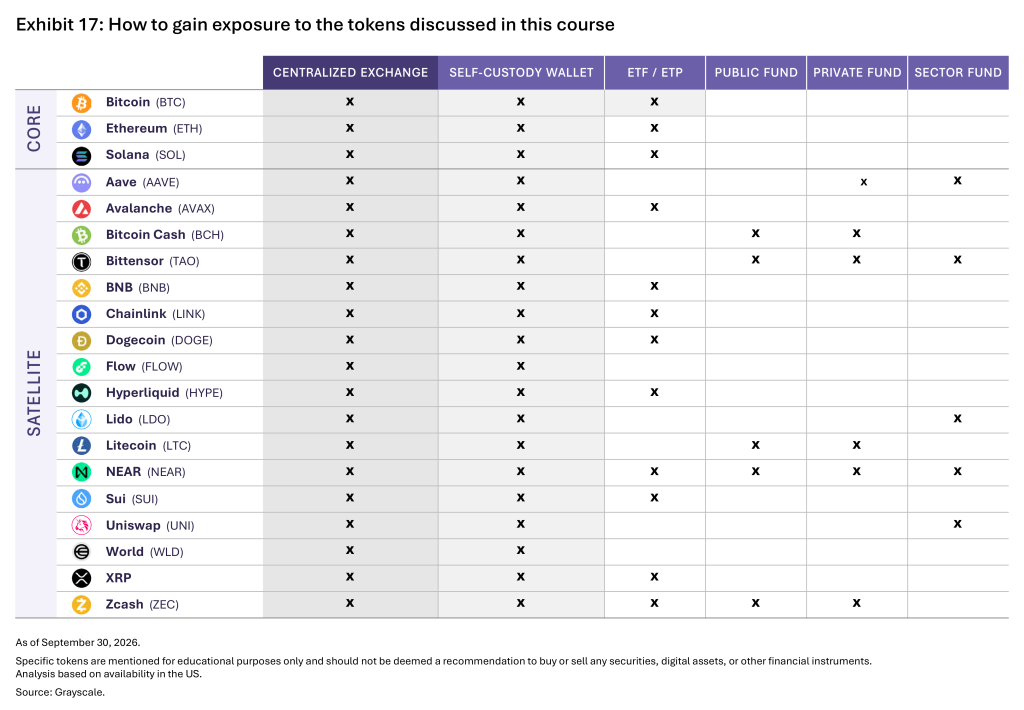
Every token covered in this course is available for purchase on a centralized exchange, and from there, investors may choose to hold their position on the exchange or move it into a self-custody wallet—a decision this series covered in detail in Primer 1.9 Since the first US-listed spot Bitcoin ETFs launched in January 2024, the number of exchange-traded products tracking individual digital assets has grown steadily; as of this writing, US investors can access exchange-traded products tracking Bitcoin, Ether, Solana, Avalanche, Sui, BNB, XRP, Zcash, Dogecoin, Chainlink, Hyperliquid, and NEAR, with some of the newer products offering staking reward participation on assets such as Ether, Solana, Sui, and Hyperliquid. (The portfolio returns modeled throughout this paper are based on asset price alone; adding staking rewards, where available, could have provided additional returns beyond those shown in Exhibits 10 through 16.)
One of the key advantages of an ETP structure is that it allows digital assets to be held within a qualified account, inside an existing financial advisory relationship; digital assets held on an exchange or in self-custody are, by definition, taxable assets held outside that relationship. Every asset in both our core and satellite hypothetical portfolios is accessible via an ETP or a public fund. A handful of tokens discussed elsewhere in this course—Aave, Uniswap, Lido, World, and Flow—are not currently accessible through a US-listed ETP or public fund, though several are available through private or sector-specific funds.
XII. Concluding Thoughts
- Digital assets have come of age and now represent a mid-sized alternative asset class.
- Investors allocating less than roughly 13% of their alternatives sleeve to digital assets are, by that measure, underweight.
- Both core and satellite digital assets have exhibited low correlation with traditional asset classes and with private markets.
- The realized volatility of digital assets has trended lower over time, a shift we attribute in part to the growth of commingled vehicles such as ETPs.
- Wider availability through ETPs has made digital assets increasingly accessible to advisors and their clients.
- A combination of declining volatility and persistently low correlation is what makes digital assets a credible candidate for inclusion in a traditional portfolio: allocations of as little as 1% to 5% improved the risk-adjusted returns of a 60/40 portfolio in every scenario modeled in this paper.
- Both core and satellite digital asset allocations enhanced returns and Sharpe ratios on their own.
- A blended core + satellite allocation of 5% struck what we view as an attractive digital asset allocation and is the approach we would encourage investors to study first.
This paper closes Grayscale Institute’s inaugural five-class course, Digital Asset Investing Fundamentals, and the eight-primer series that accompanied it. All five classes remain available on demand, and all eight primers are available for download at Grayscale Institute’s website as ongoing reference material.10
We hope the course, and this series, have offered a useful foundation for thinking about digital assets as a portfolio allocation—not as a single, homogeneous trade, but as a genuinely diverse asset class, with a valuable role to play, in our view, in a well-constructed modern portfolio.
1 – See https://institute.grayscale.com/digital-asset-investing-fundamentals-course/
2 – See https://institute.grayscale.com/primers/
3 – See https://institute.grayscale.com/
4 – For detailed explanation, see https://institute.grayscale.com/understanding-digital-asset-investing/
5 – See https://www.grayscale.com/crypto-sectors
6 – See https://institute.grayscale.com/primers/
7 – All figures in this paper cover the three years ended August 31, 2026, unless otherwise noted; equities are represented by the S&P 500 Index, bonds by the Bloomberg US Aggregate Bond Index, and the risk-free rate used in our Sharpe ratio calculations is the three-month US Treasury bill yield of 4.45%. All hypothetical portfolios are rebalanced monthly, and digital asset portfolios are measured by the performance of their underlying tokens. Allocations to digital assets in the 59/40/1, 57/40/3, and 55/40/5 portfolios are funded by selling down the equity allocation.
8 – HYPE launched in 2024; when HYPE was not available, the satellite portfolio comprised the top nine tokens by market cap as of August 31, 2026, equally weighted and rebalanced monthly.
9 – See https://institute.grayscale.com/understanding-digital-asset-investing/
10 – See https://institute.grayscale.com/
Important Information
Investments in digital assets are speculative investments that involve significant risk, including a partial or total loss of invested funds. Investments in digital assets are not suitable for any investor that cannot afford loss of the entire investment.
This material is not intended to be relied upon as a forecast, research, or investment advice, and is not a recommendation, offer or solicitation to buy or sell any securities or to adopt any investment strategy. The opinions expressed may change as subsequent conditions vary. The information and opinions contained in this material are derived from proprietary and nonproprietary sources deemed by Grayscale to be reliable, are not necessarily all-inclusive and are not guaranteed as to accuracy. Past performance is no guarantee of future results. There is no guarantee that any forecasts made will come to pass. Reliance upon information in this material is at the sole discretion of the reader.
You are solely responsible for evaluating and acting upon the education and information contained in this material. Grayscale will not be liable for direct or incidental loss resulting from applying any of the information obtained from these materials or from any other source mentioned. Grayscale does not render any legal, tax or accounting advice and the education and information contained in this material should not be construed as such. Please consult with a qualified professional for these types of advice. Grayscale and its employees may hold certain of the digital assets mentioned herein.
Specific companies, issuers, platforms, protocols, or portfolios are mentioned for educational purposes only and should not be deemed a recommendation to buy or sell any securities, digital assets, or other financial instruments. Any entities mentioned do not necessarily represent current or future holdings of any Grayscale products. No representation is being made by the inclusion of any illustrative portfolio presented herein, and past performance is not necessarily indicative of future results.
All content is original and has been researched and produced by Grayscale Investments Sponsors, LLC (“Grayscale”) unless otherwise stated herein. No part of this content may be reproduced in any form, or referred to in any other publication, without the express consent of Grayscale.
© 2026 Grayscale. All trademarks, service marks, and/or trade names (e.g., G™, GRAYSCALE®, GRAYSCALE CRYPTO SECTORS™, and GRAYSCALE INVESTMENTS®) are owned and/or registered by Grayscale.